Cooperate? Call or email me.

Miranda Graftdijk, Manager Data & Services
m.graftdijk@verzekeraars.nl
070-3338766
The Data Analytics Centre (DAC), formerly the Centre for Insurance Statistics (CVS),of the Dutch Association of Insurers employs experienced data analysts with broad knowledge about the sector, research methods, analysis techniques and dashboarding. We conduct research for insurers and other stakeholders. On this page you will get a good idea of our data projects.
Cooperation?
- Do you work with data and do you think that a collaboration with the Dutch Association of Insurers can provide even better information?
- Do you have a data issue and are insurers or knowledge about damage and risks an important source?
- Are you an insurer and do you want to benchmark data or are you walking around with a data issue?
Call or email me quickly!
Dashboards
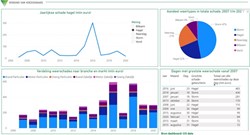
Climate Monitor - March 2021
What is the share of weather extremes such as storm, hail, precipitation and frost in the total damage to homes, business premises and vehicles? This and more can be found in the Climate Monitor.
In this first edition of the monitor, comparable damage figures are used: buildings and cars. This does not include loss of turnover. This is especially true in the agricultural sector, but also in reduced transport over large rivers due to low water levels. There is also uninsured damage due to, for example, increased subsidence, flooding of the major rivers, or damage to nature. In the long term, these types of damage will also be included in the Climate Monitor.
With reliable data on the climate and the damage impact due to weather extremes, insurers can better assess the risks of damage for their customers.
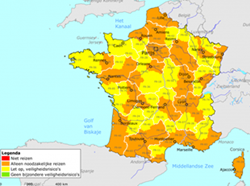
Travel advice tool – December 2020
In the summer of 2020, members indicated that they needed a central place where the ever-changing travel advice per country is kept up to date. The Data Analytics Centre then developed this tool.
Travel insurers and other interested parties can view the history of travel advice here. Clearly presented in a map, the Travel Advice Tool shows the history of the travel advice of the Ministry of Foreign Affairs.
The information in the tool comes from their website www.nederlandwereldwijd.nl.

Remaining

Home Burglary Risk Monitor - July 2019
On the basis of damage claims, insurers can map out where and when home burglaries take place. Based on this information, they can provide tailor-made prevention tips and try to stimulate home safety in all kinds of ways.
Check out our data on burglary claims.